Explore how IFS’s Norwegian customer, Glitre Energi has transformed project visibility and financial control with IFS Prepacked Analysis Models & Power BI.
Who is Glitre Energi?
Glitre Energi is a Norwegian energy and power supply company that owns and operates crucial infrastructure. All the power produced and sold is 100% renewable and is provided by the company’s hydropower plants. Headquartered in Drammen, Norway, Glitre Energi owns and operates 13 power plants and 10 partly owned power plants located in Eastern Norway. To put this into context, they have 50 transformer stations, 996 kilometers of regional power lines, and 7,100 kilometers of power lines that distribute electricity to 95,000 customers.
Glitre Energi has hundreds of projects running at the same time. Their projects vary in length and complexity and are managed by different project managers in numerous business areas. Whenever something new is built, or something must be repaired or replaced, a new project is initiated. It is, therefore, crucial for them to have a detailed overview of both projects and finances – enabling them to make informed decisions based on factual information.
Glitre Energi has been using IFS since 2000, supporting them in maintenance, finance, spare parts logistics, HCM, document management, project finance, procurement, and project management. This has enabled Glitre to keep all data in one common platform – accessible to all employees and stakeholders. Glitre also wanted to transform their reporting abilities – from static, non-visual reports to tangible visual reports that could be shared across the business for more efficient operations.
IFS Prepacked Analysis Models & MS Power BI
In 2017, Glitre Energi embarked on a new project to implement a more modern analytics and reporting tool. Bent Gabrielsen, System Coordinator in Glitre Energi, joined Glitre in 2008 and headed up this project. The aim was to keep the existing source system, have only one data warehouse solution, but be able to simplify and standardize the data warehouse and do more internally. This would make them less reliant on external resources, and of course, the new solution had to cover all reporting needs across the business.

“When you have the IFS Prepacked Analysis Models and Power BI, only imagination sets the limit to what you can visualize in the reports.”
Bent Gabrielsen, System Coordinator in Glitre Energi.
Glitre Energi decided to purchase IFS Analysis Models and use MS Power BI along with Excel to present data. The analysis models are based on Microsoft technology and SQL Server Analysis Services (SSAS). Power BI is an interactive data visualization software developed by Microsoft, focusing primarily on business intelligence. The IFS Analysis Models were very easy and quick to install. It took two weeks to test and put into production. The analysis models structure Glitre Energi’s data by name, connections, dependencies, targets, and value – the data can then be accessed straight ‘out of the box’. It was easy to implement and get started. Glitre Energi continues to utilize IFS Analysis Models for all the critical areas of the business such as finance, maintenance, procurement, and projects– enabling them to get efficient, reliable, user-friendly and up-to-date reports on the data seamlessly.
The Benefits of MS Power BI
Power BI’s two obvious benefits are that the solution is continuously developed and improved with market-leading BI and Analytics. As a result, Glitre Energi will always have access to the latest functionality and the tool as part of their Office 365-licenses.
All transactional data from IFS is seamlessly transferred into the Microsoft SSAS; they are then structured into the various analysis models –and can then be used for analysis reports in Excel or for more visual dashboards in Power BI.
Glitre Energi also made some minor adjustments to the standard BI analysis models to accommodate the internal demand for reports among their users and, in some instances, to make reporting easier for their employees. They worked alongside IFS to do this, and this can easily be done internally, as long as you have someone with SQL knowledge. For Glitre, it has also been a benefit that IFS takes the responsibility of maintaining the analysis models. The analysis models are also developed by IFS R&D – the people who know IFS best.
Visual reports in Power BI
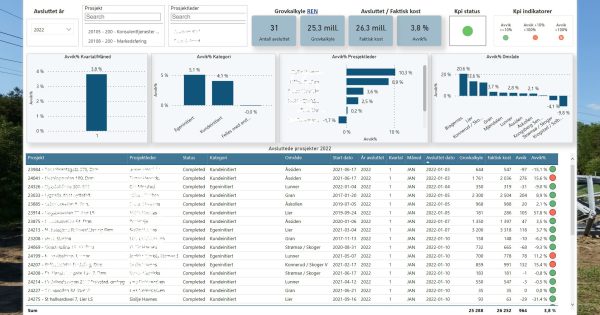
Glitre Energi has access to many different reports. For example, a report showing the KPIs on the finalized investment projects related to their transmission nets. A graph shows the total cost of a given project compared to the initial calculation and how many percent it deviates from the initial plan. The color codes indicate in a user-friendly way whether the project is within an acceptable deviation or not. This view can even be drilled down to a specific year or project manager, giving them complete insight into the data.
Another example is a visual report on procurement. The interface gives an easy overview of a number of suppliers, procurement orders, and total cost –with the ability to drill down functionality to each supplier or procurer. In Power BI, the drill-down feature allows users to go from a broad view of data to a more detailed one with a single mouse click. It also includes a so-called decomposition tree, where you can visualize data across several dimensions. This is a great interactive visual for ad hoc exploration and conducting root cause analysis.
Glitre Energi also uses more complex reporting, which combines data from several analysis models in one report. This reporting can give them a deeper insight into the status, progress, and prognosis of all their running projects. At the same time, their related costs can be visualized in different ways and drilled down on specific details.
When you have IFS Prepacked Analysis Models and Power BI, only the imagination sets the limit to what you can visualize in the reports. The solution includes a vast amount of out-of-the-box functionality, making it easy to make complex data more visual and easier to work with. With Power BI, Glitre Energi can look at each element as a whole to make better decisions. The dashboard’s visual representation allows users to quickly see the relevant data for the choices they have to make, and every important selection can be based on reliable information.
IFS Prepacked Analysis Models combined with MS Power BI gives an energy company like Glitre Energi the ability to get real-time data insight. This insight allows them full financial project control and thereby the best foundation for streamlined operations.